Graphify: A Powerful Chrome Extension for Data Visualization
Graphify is a free Chrome extension developed by Suresh Saggar that automatically converts any CSV or other delimited data into bootstrap compliant HTML5 graphs. This innovative solution allows users to easily visualize PIE, BAR, and LINE distributions, interact with the graphs to view point data, and download them as images or PDFs. With just one click on the extension icon in the Chrome toolbar, users can instantly create responsive graphs.
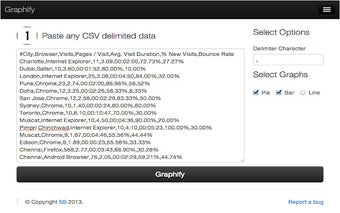
Graphify is a user-friendly tool that simplifies the process of data visualization. By simply pasting delimited data into the extension, users can quickly transform their data into visually appealing graphs. Whether you need to analyze sales data, track project progress, or present survey results, Graphify provides a convenient and efficient way to display your data.
One of the key features of Graphify is its ability to support PIE, BAR, and LINE graphs. This allows users to choose the most appropriate graph type for their data and effectively communicate their findings. Additionally, users can interact with the graphs to explore individual data points and gain deeper insights.
Another advantage of Graphify is its compatibility with all versions of Google Chrome. Whether you're using the latest version or an older one, you can rely on Graphify to seamlessly integrate with your browser.
Overall, Graphify is a powerful tool for data visualization. Its simplicity, versatility, and compatibility make it a valuable extension for anyone who needs to present data in a visual format. Whether you're a business analyst, a researcher, or a student, Graphify can help you create professional-looking graphs with ease.